How to Use Chartink Screener for Free
Chartink.com is one of the most popular stock screeners for Indian markets. It allows you to scan NSE stocks based on technical indicators, patterns, and price behavior—all in real-time. The best part? You can use Chartink’s screener for free without registration. In this beginner-friendly guide, we’ll show you how to get started, customize your scans, and find potential trades.
What Is Chartink?
Chartink is a web-based technical stock screener designed specifically for Indian traders. It lets you filter NSE stocks based on various conditions like:
- RSI, MACD, Moving Averages
- Candlestick patterns (Doji, Engulfing, etc.)
- Breakouts, crossovers, and more
- Intraday and EOD filters
Step-by-Step: How to Use Chartink Screener for Free
Step 1: Visit the Screener Page
Go to: https://chartink.com/screener
You’ll see a list of public screeners created by other traders. These are freely accessible and include popular filters like:
- RSI Overbought/Oversold
- Moving Average Crossovers
- Bullish Breakouts
- Intraday Volume Spikes
Step 2: Run a Pre-Built Scanner
- Click on any scanner title (e.g., “Stocks with RSI < 30”)
- The tool will instantly show all NSE stocks matching that condition
- Data updates in near real-time during market hours
✅ No login required
✅ Instant scan results
❌ Limited customization unless signed in
Step 3: Modify or Create Your Own Screener
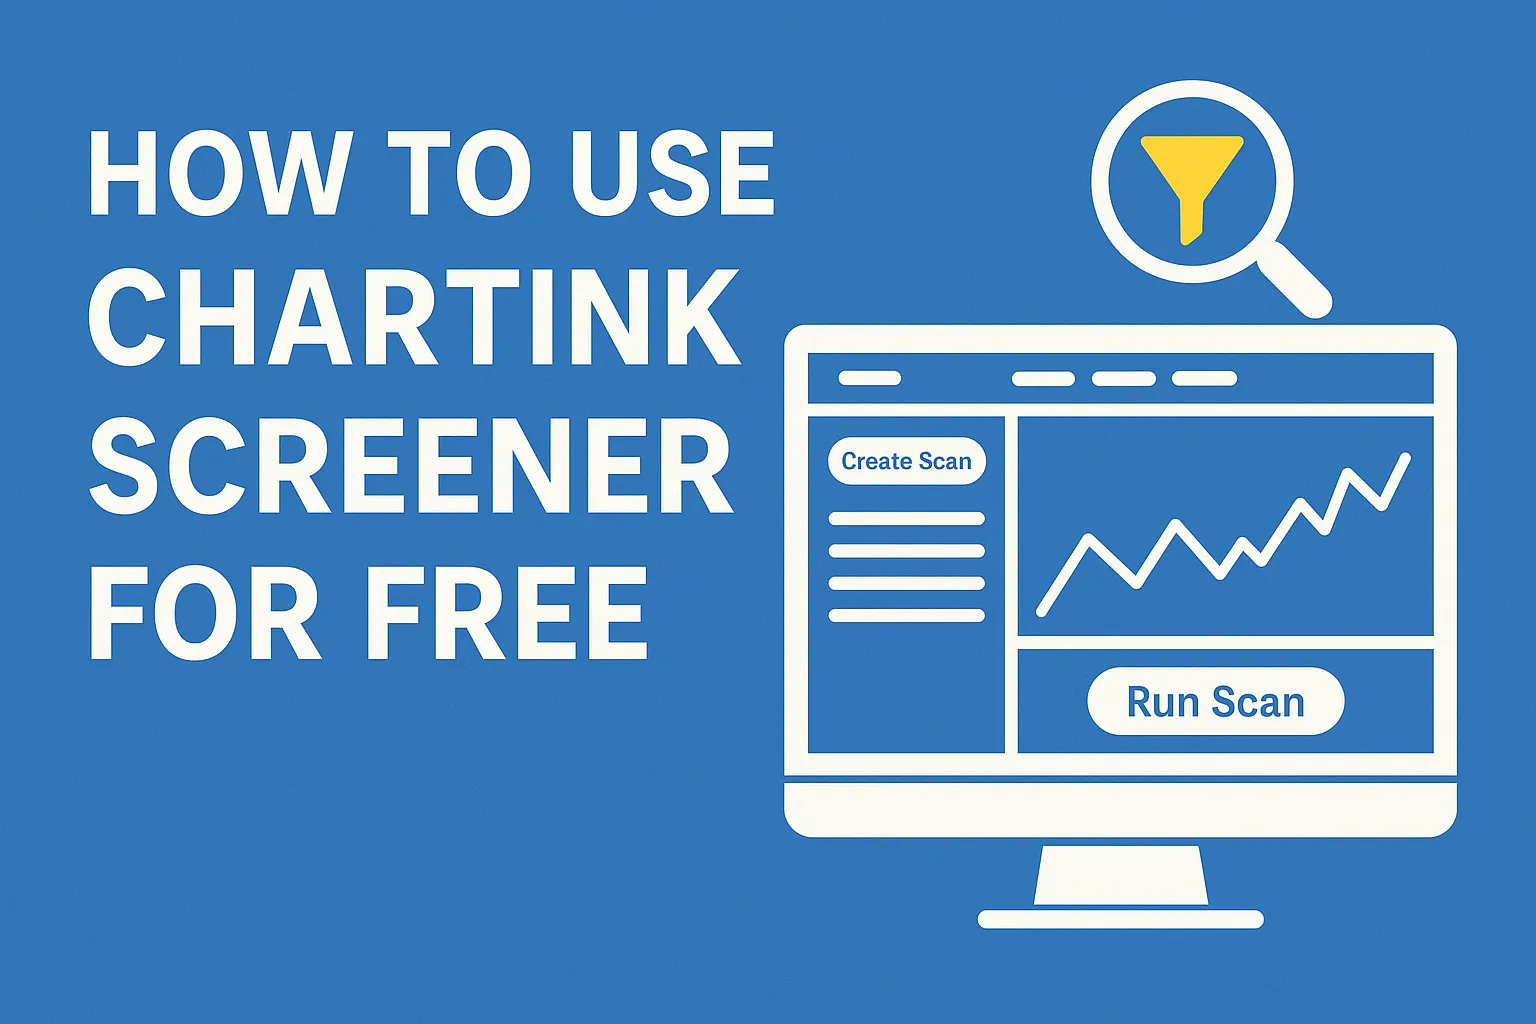
- Click on “Create Scan” in the top menu
- Add conditions using the dropdown: e.g.,
- RSI(14) less than 30
- Latest close greater than EMA(20)
- Give your scan a name and click “Run Scan”
✅ You can test strategies visually using charts
✅ Save and re-run your screener anytime (requires free login)
Step 4: Filter by Timeframes
Chartink supports multiple timeframes such as:
- Daily (EOD)
- Hourly
- 15-minute
- 5-minute
To change, click the “Timeframe” dropdown inside the scanner setup.
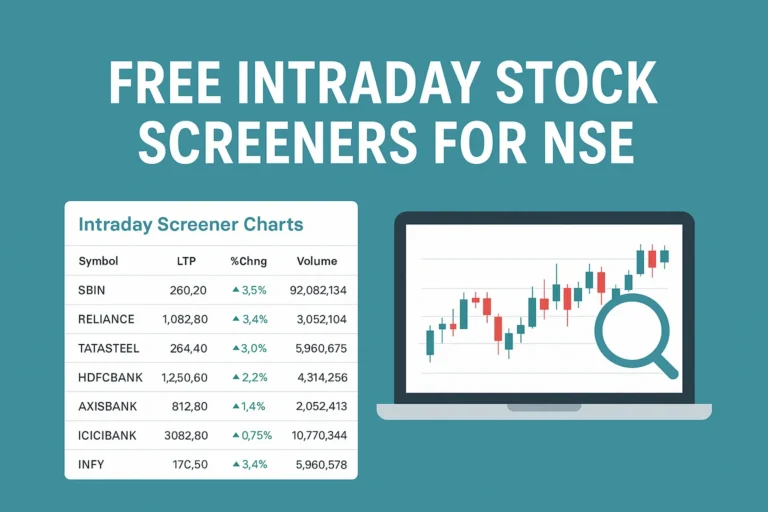
✅ Intraday scanning is available even in the free version
❌ Historical backtesting not supported
Step 5: Bookmark or Share Your Screener
Once created, you can:
- Bookmark the screener URL
- Share the link with other traders
- Export scan results to Excel (manual copy in free plan)
Best Use Cases for Free Chartink Screener
- Intraday setups: Volume spikes, price breakouts
- Swing trading: RSI/MACD crossovers, moving average alignment
- Pre-market planning: Identify stocks matching your setup
- Post-market screening: EOD scans for the next day
Chartink Free Plan Limitations
| Feature | Free Plan | Premium Plan |
|---|---|---|
| Real-time scans | ✅ | ✅ |
| Save custom screeners | ✅ | ✅ |
| Alerts (SMS/Email) | ❌ | ✅ |
| Historical backtesting | ❌ | ✅ |
| Bulk export | ❌ | ✅ |
Final Thoughts
Chartink’s free screener is a powerful tool for Indian stock traders. Whether you’re a beginner learning to spot chart patterns or an intermediate trader scanning for setups, it offers real-time insights without any cost. Start with public scans, modify as needed, and gradually build your personalized trading system.
FAQs
Q1. Is Chartink really free to use?
Yes. Basic scanning and screeners are free to use with or without login.
Q2. Can I set alerts in the free version?
No. Alerts (via SMS/email) are part of the premium plan only.
Q3. Does Chartink support intraday scans?
Yes. You can scan using 1-min to daily timeframes—even in the free version.
Q4. Can I export results from Chartink?
You can copy results manually in the free version. Export options are available in the paid plan.
Q5. Is it suitable for beginners?
Absolutely. No coding is needed, and you can start by modifying existing public scans.

